How Data Analytics and Storytelling with Data Can Enhance Business Performance - Fully Online
It is not an exaggeration to say that data analytics is changing the world. Each day, skilled analysts are working with data to discover, develop, and present insights that add value to the organizations they work for. As a result, there is strong demand for skilled data analysts to fill high-paying positions across nearly all industries.
Bundle all four courses and save 10% at checkout. Start your career-enhancing journey today!
This online professional certificate program is designed and taught by expert instructors and faculty to provide practical statistical techniques and sought-after skillsets in Data Analytics and Data Visualization. The four courses in this program will prepare you to solve real-world data problems and develop insights that lead to more informed, data-driven decisions and business actions.
The four courses must be taken in order, but each one is offered three times per year so you will have the opportunity to begin your studies program in whichever semester works best for you (Spring, Summer or Fall). The courses are delivered in an asynchronous, fully online format, which provides considerable flexibility to complete the work on your own schedule as you earn your certificate in just 28 weeks.
You’ll start by exploring how to efficiently utilize data analysis techniques and apply in-demand tools, and then how to effectively present and communicate your findings. The valuable skills you will learn in this career-enhancing University of San Diego data analytics certification not only provide you with a powerful boost to your resume, but you’ll also do hands-on exercises and project work that you can present to potential employers as part of your data analytics and data storytelling portfolio.
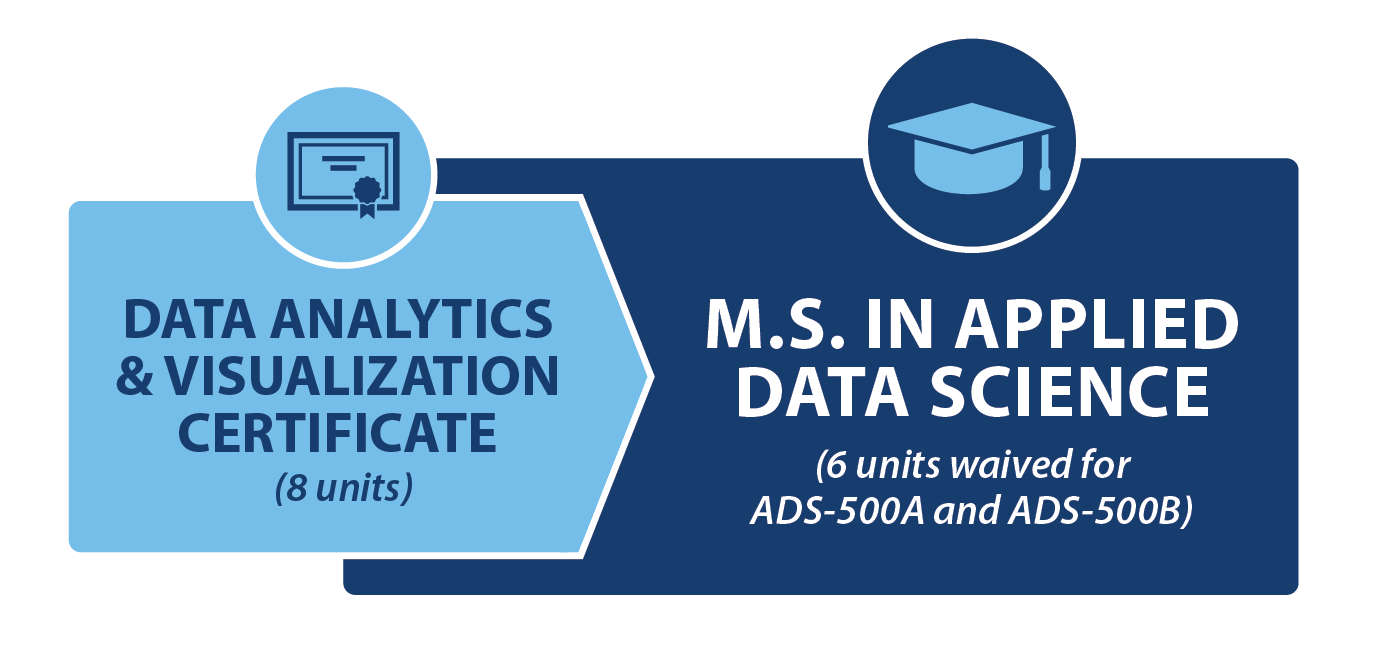
For those who are interested in advancing into data science roles in the future, it is important to note that successful completion of this Data Analytics and Visualization Certificate with a grade of B or better in each course can enable you to waive 6 units of prerequisites in the University of San Diego’s online Master of Science in Applied Data Science program.
Marcia Sue Rathfon Scholarship
USD's Data Analytics and Visualization certificate is eligible for the Marcia Sue Rathfon Scholarship. Apply today to be eligible to recieve $1,000 dollars off the cost of this certificate. Click here to learn more.
Bundle and Save 10% at Checkout
Data Analytics and Visualization Certificate - Bundle and save 10% when you enroll in all four courses (must add all 4 courses in one transaction for discount):
- DAV-X800 Essentials of Analytics in Excel
- DAV-X801A Data Visualization & Storytelling with Tableau
- DAV-X801B Data Analytics with Python and R
- DAV-X802 Data Analytics and Visualization Capstone
To apply credit, select the checkbox and select "BUS - DAV Bundle and Save 10%" for a discount on each course.
**Only one discount can be applied per course.**
Who Should Attend
The USD data analytics certification courses are well-suited to a wide range of potential students, not just those who have related work experience or bachelor’s degrees in STEM, math or science fields. Mid-career professionals who have some experience working with data and technology will also be well-positioned for success.
Ideal data analytics certificate program candidates include:
-
Professionals who want to become familiar with data literacy and explore and advance their career in any data-driven field
-
Anyone who is interested in breaking into the fast-growing field of data analytics and practicing in-demand tools and techniques
-
Individuals with a college degree or current degree-seeking students who are interested in boosting their resume by getting hands-on experience in fundamental data analytics, storytelling with data, data ethics and visualizations to elevate their analytical knowledge in a wide variety of industries
Schedule & Fees
This program is delivered fully online, learn more about this program and individual cohorts by downloading the program snapshot by clicking on this link, or contact us at pce-bus@sandiego.edu for more information.
|
Required Courses
with Links for Enrollment
(8 Units) |
Duration |
SP 2024 |
SU 2024 |
FA 2024 |
Fee |
Fee
w/Bundle
|
|
7 weeks |
Jan 23 - Mar 11 |
May 21 - Jul 8 |
Sept 3 - Oct 21 |
$1,375 |
$1,237 |
|
|
DAV-X801A, Data Visualization & Storytelling with Tableau |
7 weeks |
Mar 12 - Apr 29 |
Jul 9 - Aug 26 |
Oct 22 - Dec 9 |
$1,375 |
$1,237 |
|
7 weeks |
May 5 - Jun 24 |
Sept 3 - Oct 21 |
Jan 21 - Mar 10 |
$1,375 |
$1,237
|
|
|
DAV-X802, Data Analytics and Visualization Capstone |
7 weeks |
Jun 25 - Aug 12 |
Oct 22 - Dec 9 |
Mar 18 - May 5 |
$1,375 |
$1,237 |
| One Time Certificate Fee | $45 |
$45 |
||||
| Total Certificate Cost (4 courses) | $5,545 |
$4,993 |
||||
| All courses are delivered in our Online Fixed-Date (OFD) modality. *Schedule and fees subject to change | ||||||
Benefits of the Data Analysis and Visualization Certificate Program
Students who complete the online Data Analytics and Visualization Certificate will:
-
Receive a comprehensive foundation in data analytics concepts, principles, techniques, tools, strategies, and more
-
Gain proficiency in several key data analytics tools (Python, R, Tableau, Excel)
-
Learn skills that add value in your current job or organization
-
Position yourself from an incredible range of job opportunities (a recent LinkedIn search lists 100,000+ data analytics jobs)
-
Build a foundation for a meaningful, high-paying career in the fast-growing data analytics field
-
Be able to apply credits earned in the certificate program to USD’s Applied Data Science master’s degree program after earning a B or better in each course
Data Analytics Certificate Curriculum
The four courses in our program have been thoughtfully crafted to build your knowledge and skills, and position you for success in your career and in the employment market. Each course is seven weeks long. Let’s take a closer look (click on the individual course links for additional details):
Essentials of Analytics in Excel
Microsoft Excel is a very important tool in the world of data analytics. This course offers students a jumping-off point into the world of visualizations and data-driven decision-making while exploring how Excel is used in fundamental statistical concepts (i.e., descriptive statistics, statistical inference, and regression analysis). Participants will become adept at using such tools as Pivot Tables, the Data Analysis ToolPak, the VLOOKUP function and more.
Data Visualization & Storytelling with Tableau
This hands-on course introduces students to the process of developing meaningful data visualizations to provide actionable information for relevant audiences, using the visual analytics software platform Tableau — another essential data analytics tool. Participants will learn data ethics and theory of data storytelling, and use Tableau to visually analyze data and create meaningful dashboards
Data Analytics with Python and R
Learn the fundamentals of utilizing in-demand programming languages Python and R for data exploration, data cleaning and data visualization. This course approaches data analytics programming in a practical and accessible manner, using a hands-on approach that assumes no prior knowledge of the subject. It is to enhance the ability of professionals from any field to utilize data analytics when making business decisions. Students will also develop a foundational understanding of machine learning.
Data Analytics and Visualization Capstone
The goal of the Data Analytics Capstone course is to integrate the knowledge and skills gained from the three previous courses to create a proposal, prepare and analyze data, create visualizations, and present a comprehensive hands-on project. Visualizations will include graphs and charts embedded in the presentation, as well as a final interactive dashboard, ideally hosted on the web for use in the student’s e-portfolio.
Certificate Requirements and Fees
To earn the University of San Diego’s Data Analytics and Visualization Certificate, students must complete each of the program’s four courses. In addition to the tuition for each course, there is a one-time $45 certificate fee.
Your Data Analytics and Visualization Certificate can be completed in as few as two semesters (28 weeks).
USD certificate programs provide a rigorous program of study that demonstrates a progression of learning and the mastery of a specific body of knowledge. Learn more about the University of San Diego’s Professional and Continuing Education Certificate Benefits and Policies.
What Does a Data Analyst Do?
Data analysts gather, prepare, explore, and analyze specific raw data to generate valuable insights, answer important questions and solve problems for their employers. The job often involves identifying business objectives and useful data patterns, usually in the interest of generating information that equips their organizations to make more informed, data-driven decisions before implementing strategies and actions. Therefore, the job also involves producing reports to present their findings, often using effective visualization techniques that help make the information accessible for their key stakeholders.
Data analysts today are doing valuable work for companies across nearly every industry. And the idea of using data to answer questions is at the heart of the job — specifically four types of questions:
-
Descriptive analytics answers the question: “What happened?”
-
Diagnostic analytics answers: “Why did something happen?”
-
Predictive analytics answers: “What is likely to happen?”
-
Prescriptive analytics answers: “What action should be taken?”
Some of the important skills needed by data analysts:
-
Critical thinking and problem solving
-
Python and R
-
Statistical knowledge
-
Tableau (business intelligence tools)
-
Spreadsheets (Microsoft Excel)
-
Data visualization & storytelling with data
-
Effective presentation and communication
-
Domain knowledge
Job Market and Career Outlook
Data analysts are in demand by top employers across the country and beyond in nearly all sectors today — health care, finance, cybersecurity, aerospace, media, transportation, higher education, government and military, energy, retail and eCommerce, professional sports, and more.
Employment websites Indeed.com and Salary.com report the average salary for data analysts to be $75,000+. Here is a quick sampling of data analytics job openings during a recent LinkedIn search.
-
Apple – Data Analytics Manager ($114K–$119K)
-
Siemens – Business Analyst, Data Analytics ($56K – $113K)
-
SmartSense – Data Analyst ($68K – $91K)
-
State of Rhode Island – Data Analyst ($60K – $81K)
-
Federal Reserve Bank of Boston – Data Analyst ($67K – $90K)
-
VCA Animal Hospitals – Data Analyst
-
Nike – Data Analytics Manager ($105K–$135K)
-
Uber – Data Analyst, Global Analytics & Insights; San Francisco ($81K–$123K)
For those who are seeking to launch a career in this fascinating and fast-growing field, earning your Data Analytics and Visualization Certificate is a smart investment in your future.
Experienced Instructors
The online professional Data Analytics and Visualization Certificate program is designed and taught by expert instructors and faculty with real-world experience in data analytics, visualization, and data science.
What People Are Saying About Data Analytics
“Business analytics is a powerful tool in today’s marketplace. Across industries, organizations are generating vast amounts of data which, in turn, has heightened the need for professionals who know how to interpret and analyze that information.”
– Matt Gavin, Harvard Business Review
"Data literacy is an increasingly important and valuable skill set. Enrolling in this program allowed me to develop a robust understanding of data analysis concepts and tools in a way that I was able to apply new skills professionally as I was learning them. I notice I am better prepared to validate information presented to me, more capable of finding and presenting insights from data and more confident in tools like Excel and Tableau."
– Josh Bragg, National Asset Optimization Manager
Third-Party Funding Approved Program
USD’s Data Analytics and Visualization Certificate is a Workforce Innovation and Opportunity Act approved program. Please be advised that the University of San Diego, Professional and Continuing Education cannot approve students for WIOA nor confirm their eligibility. You must contact or visit your local America’s Job Center of California to confirm your eligibility towards WIOA funding.
Data Analytics Certification – Frequently Asked Questions (FAQs)
Do I need a background in data analytics to succeed in this certificate program?
No. College-educated professionals who have some experience working with data and technology will be well-positioned to gain a strong foundation in data analytics from this 100% online professional development program.
Are the Data Analytics Certificate courses transferable to a master’s degree program?
Yes. Students who complete the Data Analytics and Visualization Certificate with a grade of B or better may be eligible to waive 6 units of prerequisites in the University of San Diego’s online Master of Science in Applied Data Science program.
What are some of the most important learner outcomes from this data analytics program?
There are many. In addition to gaining a strong foundation in data analytics and visualization, students will gain experience with important, sought-after data analytics tools like Excel, Tableau, R, and Python.
How will this program help me advance my career?
In addition to gaining certification in a well-compensated, in-demand field, students who complete the Data Analytics and Visualization Certificate program will also do hands-on exercises and Capstone project work that can be presented to potential employers as part of your data analytics and visualization portfolio.
According to data analytics resource KDnuggets, the top 8 reasons to earn your data analytics certification are:
-
High demand for analytics professionals
-
Huge deficit of skilled professionals to fill the jobs
-
High Salaries
-
Data analytics is a top priority in many organizations
-
Flexibility to work in most any sector
-
Practical knowledge you can put to use immediately
-
A structured learning approach
-
No prerequisites for enrolling the certification program
What is a certificate program?
USD certificates are rigorous programs of study that demonstrate a progression of learning and the mastery of a specific body of knowledge. Certificates at USD are a minimum of 8 semester units of coursework, and have gone through extensive community reviews, curricular oversight and university approvals before they are offered for continuing education or professional development.
Accreditation
The University of San Diego, a prestigious university with a long history and a strong reputation for academic excellence, is accredited by the Western Association of Schools and Colleges (WASC).